RSCH FPX 7864 Assessment 4 ANOVA Application and Interpretation
Student name
Capella University
RSCH FPX 7864
Professor Name
Submission Date
Data Analysis Plan
Analysis of variance (ANOVA) is a statistical method of comparing several group classifications. The method simultaneously compared the means of the independent groups for detecting significant differences between group means. ANOVA is used as an initial step in hypothesis testing and is important for making valid conclusions from experiments regarding different groups in the experimental design. The technique uses the F-statistic together with the p-value to identify statistically significant results. In the present evaluation, the chi-square analysis will be used to determine if there are significant differences in the correct responses of students from each of the classroom sections on Quiz 3.
Section and Quiz 3
The section is categorical: it designates which classroom group a student belongs to; Quiz 3 is continuous: it measures student performance based on the number of times they got the third assessment correct.
Research Question
Is there any statistically significant difference in the number of quiz 3 correct answers among the different classroom sections?
Null Hypothesis (H0)
No difference is found in the number of correct answers to Quiz 3 for the different classroom sections.
Alternative Hypothesis (HA)
The differences in the number of Quiz 3 correct responses between classroom sections are statistically significant.
Testing Assumptions
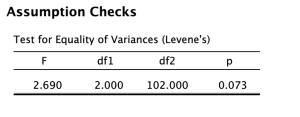
Assessment of the homogeneity of variance was conducted using a widely used statistical test of approximately equal group variances, Levene’s test. The test is used to test the null hypothesis that all groups being compared have the same variance. A key assumption is that the cases in the various comparison groups are approximately equally spread. Results showed Levene’s F(2, 102) = 2.690, p = .073, suggesting that the probability value obtained was greater than .05 and therefore, not enough evidence to reject the null hypothesis of equal variances. Even if assumptions of ANOVA are violated, the results of the analysis do not necessarily weaken the conclusions, but violations of any assumptions can make the analysis less precise and less powerful, and may warrant consideration of alternative models.
Results and Interpretation
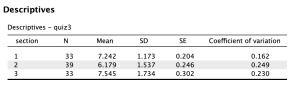
All groups are presented by section variable, with mean (M) and SD values for the outcome of Quiz 3 shown below.
- Section 1: M = 7.242, SD= 1.173
- Section 2: M = 6.179, SD= 1.537
- Section 3: M = 7.545, SD= 1.734
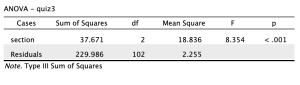
Results from Quiz 3 showed rather large differences between the classroom sections in both the mean scores and the standard deviations. The highest mean score of (M =7.545, SD=1.734) was attained in Section 3. Analysis indicated that Section 2 had the lowest mean score (M=6.179, SD=1.537) while Section 1 was moderately lower than Section 3. A one-way ANOVA showed that the results were statistically significant (F(2, 102) = 8.354, p < .001); thus, it is quite acceptable to reject the null hypothesis that there is no difference between classroom sections in terms of Quiz 3 scores. Reviewing the value of the F statistic shows that group variance was much higher than the within-group variance, indicating that there was a significant relationship between section membership and Quiz 3 scores. Also, a probability value is obtained, which is consistent with the conclusion that the performance differences observed between classroom sections are not sufficiently explained by random variation. The results show that there are statistically significant differences in the performance of at least two classroom sections; the null hypothesis is rejected, and the alternative hypothesis is accepted.
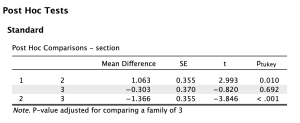
Analysis of variance (ANOVA) was followed by a Tukey’s honest significant difference (HSD) test to find which of the group means were significantly different from the others. The post hoc comparison of each of the means is done to find out specifically where each of the means is significantly different after an analysis of variance indicates a significant test result (Agbangba et al., 2024). According to the analysis, the means of the quiz scores for Section 1 and Section 2 show a significant difference, with Section 1 (M = 6.179) and Section 2 (M = 7.242), with p = .010, which is less than the alpha value of .05. The difference between Section 3 (M =7.545) and Section 2 (p =.001) is also very significant in favour of Section 3. While there is an observed difference between the means of Section 1 and Section 3, there is no statistical difference (p =.692), which suggests that the performance mean across both Sections is essentially the same, although Section 3 did achieve a different, but slightly higher, mean score than Section 1. Analysis indicates that the t statistic confirms the results of the HSD for all t statistics that are based on a mean difference between any two groups across participants in Sections 1 and 2 (t =2.993; p=.010); and across Sections 2 and 3 (t=-3.846; p<.001). To summarize the above HSD test results (based on all three means for each student), the two students in each of the groups (1 and 3) are performing at what seem to be similarly high levels, while the students in Section 2 are performing at significantly lower levels compared to those of both the 1 and the 3 groups, suggesting that further discussion is warranted regarding the factors influencing the delivery or the environment for instruction.
Statistical Conclusions
The results of the one-way ANOVA testing the performance of the three classroom sections yielded a significant difference among the performances of the three sections, F(2, 102) = 8.354, p < 0.001, with the null hypothesis being rejected. The results of Levene’s test were supportive, as it was found that the assumption of homogeneity of variance, F = 2.690, p = 0.073, was met for the ANOVA analysis. The three sections had different mean scores and standard deviations based on their performance, as follows: Section 1 (M = 7.242, SD = 1.173); Section 2 (M = 6.179, SD = 1.537); Section 3 (M = 7.545, SD = 1.734), as per the analysis. Tukey’s HSD was used to conduct the post hoc analysis, and results showed that Section 2 was significantly lower than both Section 1 and Section 3 post hoc analysis, while Section 1 was not significantly lower than Section 3, and the mean score for Section 3 was slightly higher than the mean score for Section 1. The results of the study clearly indicate that differences exist in performance on Quiz 3 depending on section membership, confirming that the null hypothesis (of no difference among the means of the various sections) should be rejected. Outside of that, the results indicate that there may be differences in the instruction given or some other section-specific aspect that could have played a role in the differences in performance, including large differences between mean scores across sections.
Limitations
When interpreting the study of ANOVA data, it is important to consider not only the restrictions that come with the use of the ANOVA statistical method, but the limitations of the real-world application of the ANOVA methodology itself. ANOVA is a statistical procedure that is subject to many assumptions; if these assumptions are violated, including that of normality, then errors in the analysis will occur, such as the Type I error (Editage, 2023). Further, the uncontrolled confounding variables, which varied between the three sections (e.g., variations in teaching style, variations in subject difficulty, and differences in the timing of assessments across the three sections), can add bias to the analysis and thus reduce its validity. Levene’s test shows that there is adequate variability, but further testing should be performed to see if the normal distribution assumption is met for the three sections, for the purposes of accepting an ANOVA. Furthermore, the absence of adequate estimates of the sample sizes in the three sections creates uncertainty about the level of statistical power as well as the amount of variability in the results. If they are well-represented in all three sections, then they will be more credible in the analysis and serve as evidence for teachers to assist in instructional development.
Application
A major application of the Analysis of Variance (ANOVA) in clinical nursing research is that it allows the researcher to analyze two or more patient populations and two or more modes of care delivery at the same time. One example would be a nursing unit in a hospital that wants to know whether a series of education sessions, delivered by nurses, affects medication adherence. The nursing unit could compare the level of adherence with medication for diverse groups of patients that received different modes of structured nurse-led education, such as those receiving both structured one-to-one and group education sessions versus patients receiving only conventional discharge instructions, using ANOVA. The independent variable would be a structured individual education session, a structured group education session, or standard-only education, and the dependent variables would be medication adherence rates of the patients at the follow-up measurements. An ANOVA will create the opportunity for nursing leadership to statistically substantiate meaningful differences and redesign the nursing protocols, redistribution of nursing staff to patient education, and targeted nursing staff development to enhance medication adherence. The principle here is that there is a direct link or correlation between structured NLHE and patient understanding/knowledge of and long-term compliance with prescribed medication therapy. Poorly educated patients at discharge are a factor that has been correlated with higher readmission rates and poor patient outcomes, which further represents a need for evidence-based nursing interventions. Support for the patient transition at discharge, patient education, and evidence-based nursing interventions need to be grounded in systematic, data-driven structures to meet the educational needs of patients. Aside from medication adherence, patients can be compared across treatment groups using ANOVA to compare wound healing rates, pain management outcomes, patient satisfaction scores, and fall rates when patients are treated with either of these nursing strategies. Continuing usage of ANOVA in the clinical nursing field will eventually improve patient safety, nursing practice quality indicators, and reduce the occurrences of practice deficiencies in clinical units.
References
Agbangba, C. E., Aide, E. S., Honfo, H., & Kakai, R. G. (2024). On the use of post-hoc tests in environmental and biological sciences: A critical review. Heliyon, 10(3), e25131. https://doi.org/10.1016/j.heliyon.2024.e25131
Berardinelli, D., Conti, A., Hasnaoui, A., Casabona, E., Martin, B., Campagna, S., & Dimonte, V. (2024). Nurse-led interventions for improving medication adherence in chronic diseases: A systematic review. Healthcare, 12(23), 2337. https://doi.org/10.3390/healthcare12232337
Editage. (2023, March 23). What Is ANOVA (analysis of variance): Definition, types, uses & assumptions | Editage. Editage.com. https://www.editage.com/blog/anova-types-uses-assumptions-a-quick-guide-for-biomedical-researchers/
Emmanouilidou, E., Krishnan, D., Kaplan, E., Moritz, V., Kaloti, I., Sengupta, S., Czypinski, L., Dowling, E., Simon, W., & Dermenchyan, A. (2025). Nursing recommendations to improve discharge and care transitions from the bedside. Journal of Patient Safety, 21(8), 552–558. https://doi.org/10.1097/PTS.0000000000001382
Jones, G. P., Stambaugh, C., Stambaugh, N., & Huber, K. E. (2023). Chapter 30 – Analysis of variance. In ScienceDirect (pp. 171–177). https://www.sciencedirect.com/science/article/pii/B9780323884235000418
Schubert, A. L., Steinhilber, M., Kang, H., & Quintana, D. S. (2025). Improving statistical reporting in psychology. Communications Psychology, 3(1), 156. https://doi.org/10.1038/s44271-025-00356-w
Zhou, Y., Zhu, Y., & Wong, W. K. (2023). Statistical tests for homogeneity of variance for clinical trials and recommendations. Contemporary Clinical Trials Communications, 33(1), e101119. https://doi.org/10.1016/j.conctc.2023.101119