

Part 1: Histogram
Figure 1
Lower Division
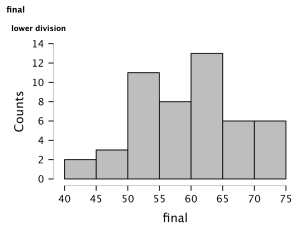
Figure 1 shows a histogram that displays the distribution of scores in the final examination among the lower division students. As an exploratory data analysis tool, the histogram is useful in creating a visual representation of the data that helps in the identification of patterns and trends in the data. The scores are measured using 5-point intervals from 40 to 75, which makes the determination of the number of students who scored in each interval easy. There are approximately 13 students in the interval containing scores from 60 to 65, and this interval has the greatest frequency in the data and is the modal class. The scatter of the scores shows that the majority of pupils performed at a high level and there was very little of pupils performing at the lower end. The scores make the tail of the distribution longer on the lower end, which is an indication that the data is negatively skewed or left-skewed.
Figure 2
Upper Division
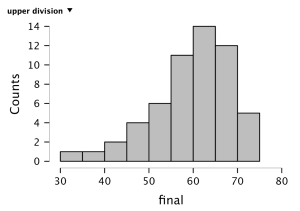
The scores for the students in the exam are shown in this histogram in 5-point class intervals from 30 to 80. Each bar of the histogram provides information on a range of upper-division students with the same score, allowing for an easy-to-understand overall distribution of performance levels. It is very useful to have a score range, as it allows us to see the performances of students who perform at different levels of the score. The distribution of scores in the histogram allows for a proper understanding of the distribution of students in different score ranges. The highest number of students is observed in the score range of 65-70, with about 14 out of 56 students belonging to the category. According to a study, histograms are very helpful in data analysis by providing a proper understanding of the distribution of data. In addition, the general form of the histogram suggests that the data on test scores are normally distributed.
Table 1
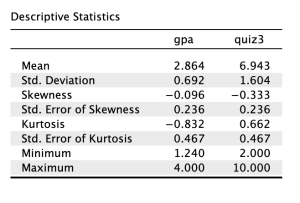
Measures of central tendency, such as the mean; measures of variation, such as the standard deviation; measures of skewness, such as the $Q_1$-$Q_3$ range; and measures of kurtosis, such as the ratio of interquartile range to median, are important for understanding the distributional properties of a dataset. The difference between the mean and the standard deviation allows you to optimize the understanding of the nature of the dispersion of the data around the mean: the smaller the difference, the less dispersed the data, and the more concentrated it is around the mean. The average (mean) point value associated with the variable grade point average (GPA) is 2.864, and the standard deviation is 0.692. The sum of the two is 3.556, which means that the scores around the mean are quite close, and the data have a high central tendency. Similarly, for Quiz 3, the mean value is 6.943, and 1.604 is the standard deviation. The upper bound value is 8.547, indicating that the scores are relatively clustered around the mean, with an acceptable amount of variation. Other measures of distribution, such as skewness and kurtosis, can also be used to determine the normality of the distribution, in addition to the measures of central tendency and dispersion. The skewness value for GPA is −0.096, within the acceptable range of ±2; the value of Kurtosis is −0.832, which is also within the acceptable range of ±2, also indicating a normal distribution. Likewise, the skewness of Quiz 3 is −0.333, and the kurtosis is 0.662, which also supports the assumption of normality.