RSCH FPX 7864 Assessment 2 Correlation Application and Interpretation
Student name
Capella University
RSCH FPX 7864
Professor Name
Submission Date
RSCH FPX 7864 Assessment 2 Correlation Application and Interpretation
The analysis attempts to explore the correlation between students’ GPAs and their Quiz 1 performance to determine what might account for any poor (weak) correlation that exists. This investigation also takes into account various factors that could influence the discrepancies between the GPA and the Quiz scores, such as the format of the assessment, the content of the Quiz, and what is measured by the Quiz (knowledge or skills). Examining the Skewness and Kurtosis values will also give insight into the normality of the variables.
Variables in the Analysis
- Quiz 1: Number correct – Continuous, Ratio scale.
- Previous grade point average (GPA): Continuous variable (on an interval scale).
- Total: Number of points received in class (CV – ratio scale).
- Final: Number of correct answers on the final – Continuous variable, measured at the ratio level.
Total-Final Correlation
Research Question: Is there a significant correlation between how many points are earned in class and how many answers are correct on the final exam?
Null Hypothesis (H₀): There is no significant relationship between the total number of points acquired in class and the number of correct answers they get when they take the final exam.
The Alternate Hypothesis (HA): There is a significant correlation between total points gained in class and the number of correct answers on the final exam.
GPA-Quiz 1 Correlation
Research Question: Will the number of correct answers on Quiz 1 and the GPA be significantly correlated?
The null hypothesis (H₀): There is no significant correlation between the number of correct answers on Quiz 1 and GPA.
Alternative Hypothesis (HA): The number of correct answers on Quiz 1 and GPA are significantly correlated.
Testing Assumption
Figure 1
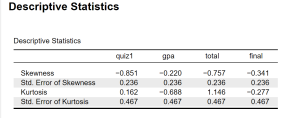
To determine normality, the skewness and kurtosis of the four main variables – Overall GPA, Final Exam Score, Quiz 1 Score, and Total Points were analyzed. With relatively low frequencies of the values, the skewness statistics support this point, and values ranging from -2 to +2 indicate a normal distribution. The calculated skewness for GPA was -0.851, which indicates some left-tail skewing; this suggests that lower values of GPA will be more common than higher values of GPA. Likewise, the total score was slightly left-skewed with a skewness of -0.757; the scores from the final exam and Quiz 1 were also left-skewed with skewness values of -0.341 and -0.220, respectively. A quadratic kurtosis value was found in Quiz 1, GPA (0.162), total (1.146), and the final exam (-0.277). The range of kurtosis values for GPA and the final exam is negative, indicating wider and flatter peaks than a normal distribution, and the range for the total score is positive, indicating a sharper peak. All the skewness values and all the kurtosis values are within the range of -2 to +2, which indicates that the data set is consistent with the normality assumption and thus appropriate for the use of inferential statistical analysis.
Results and Interpretation
Figure 2
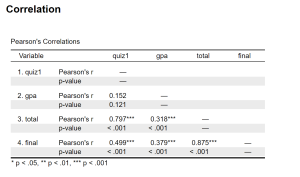
The relations between four important variables: GPA, Quiz 1 score, total class score, and final exam score were investigated with a Pearson correlation matrix. Analysis showed that there was a positive linear correlation between the total grades and the final exam scores, with a Pearson correlation coefficient (r) = 0.88, df = 103, and a highly significant p-value of < 0.001. The result is expressed as r(103) = 0.88, p < .001. The p-value is much smaller than the commonly accepted value of 0.05, so the null hypothesis (H₀) is rejected, thus indicating a statistically significant and high positive correlation between the two variables studied. The correlation of GPA to Quiz 1 scores, on the other hand, was low. The Pearson correlation coefficient value for the relation was 103 d.f. = 0.152, and the p-value was 0.121. Since the p-value is greater than the significance level of 0.05, the null hypothesis (H₀) is accepted, and it is inferred that there is no significant difference in the performance of students in Quiz 1 based on their GPA in the dataset. With only 105 students in the study, this is still a significant difference, as GPA has little correlation with Quiz 1 scores, although it does have a strong correlation with overall grades, and overall performance measures (such as grade) predict exam success better than quiz performance measures (such as GPA).
Statistical Conclusions
Four variables—GPA, Quiz 1 scores, total class scores, and final exam scores—were analyzed using Pearson correlation tests for the relationships among them. The distributions of both GPA and final exam scores were slightly negatively skewed and kurtotic, suggesting that they have a distribution very close to a normal curve, with little deviation from it. The results of the analysis showed that there was a high statistically significant positive correlation between total grades and final exam grades, with a Pearson correlation coefficient of 0.88 and a p-value of < 0.001, which is denoted as [r(103) = 0.88, p < .001]. The overall meaning of this significant correlation is that the cumulative scores of the students predict their exam scores fairly poorly ( p = 0.121 [r(103) = 0.152]). Although the p-value > 0.05, these results still highlight an interesting difference in the strength of the correlations and indicate that a comprehensive assessment of academic performance may be a better reflection of academic success than the GPA alone.
Limitations
Pearson correlation coefficient (r) is a commonly used statistical analysis to determine the linear correlation between two variables. The coefficient does have some limitations that should be taken into account when interpreting the results. There are two restrictions: 1) the Pearson correlation is a linear correlation of the variables; 2) both variables must be continuous. When the underlying relationship is non-linear, this test might not detect the strength or nature of this relationship. An additional major drawback is that correlation does not equal causation. The presence of a strong correlation does not guarantee causality between the two variables, since there could be other variables or factors involved. In addition, the Pearson correlation coefficient may not be suitable for data sets that have a limited range or contain small data sets, impacting the generalizability of results. Other factors that might explain the results observed are the chance of a co-occurrence or the effect of a third or other variable that was not studied (Janse et al. 2021). In order to overcome the shortcomings, robust statistical tools such as Spearman’s rank correlation in the case of an interaction effect that is non-linear or regression analysis in the case of the presence of confounding factors could be applied.
Application
A possible analysis of this data would be to examine the relationship between lung function data (e.g., forced expiratory volume in 1 second [FEV1]) and patient-reported outcomes (e.g., quality-of-life score). Lung function (FEV1) is a common test of lung health, and quality of life (QOL) scores help to see how pulmonary diseases affect life in general. Identification of the relationships between the variables will evaluate how physiological impairments become functional and psychological problems, which will guide the strategies in patient care.
The other correlation that might be relevant is between the degree of pulmonary obstruction (such as FEV1/FVC ratio) and the number of exacerbations in COPD patients. This relationship is very important since the more often the exacerbations occur, the worse the outcome, and it is also likely to indicate disease progression. Regarding chronic pulmonary disease, high correlations can help predict high-risk patients and make decisions about interventions (including changing medications or taking preventative steps) to optimize chronic pulmonary disease management. The ability to utilise these kinds of analyses can correlate clinical metrics with real-life patient experiences and help define how the disease is being monitored, as well as the effectiveness of the therapy.
Conclusion
Correlation analysis provides valuable insight into the strength and direction of relationships between variables, making it an essential tool in quantitative research. Through the interpretation of correlation coefficients, scatterplots, and significance values, researchers can identify meaningful associations and better understand data patterns. The findings from this assessment demonstrate how statistical relationships can support evidence-based decision-making and contribute to research accuracy. While correlation helps determine whether variables are related, it does not establish causation. Overall, correlation analysis enhances the ability to draw informed conclusions, evaluate research questions, and support future investigations with reliable statistical evidence.
References
Barbosa, R. M., Douce, T., & Mansfield, S. (2022). Continuous-variable nonlocality and contextuality. Communications in Mathematical Physics, 391(3), 1047–1089. https://doi.org/10.1007/s00220-021-04285-7
Chesov, D., Butov, D., Reimann, M., Heyckendorf, J., Myasoedov, V., Butov, T., Akymenko, O., & Lange, C. (2021). Impact of lung function on treatment outcome in patients with TB. The International Journal of Tuberculosis and Lung Disease, 25(4), 277–284. https://doi.org/10.5588/ijtld.20.0949
Garren, S. T., & Osborne, K. M. (2021). Robustness of the t-test based on skewness and kurtosis. Journal of Advances in Mathematics and Computer Science, 9(3), 102–110. https://doi.org/10.9734/jamcs/2021/v36i230342
Iakovlev, A. U., & Utochkin, I. S. (2023). Ensemble averaging: What can we learn from skewed feature distributions? Journal of Vision, 23(1), 5–16. https://doi.org/10.1167/jov.23.1.5
Janse, R. J., Hoekstra, T., Jager, K. J., Zoccali, C., Tripepi, G., Dekker, F. W., & van Diepen, M. (2021). Conducting correlation analysis: Important limitations and pitfalls. Clinical Kidney Journal, 14(11), 2332–2337. https://doi.org/10.1093/ckj/sfab085
Mittal, R. (2019). Multivariate regression predictive modeling in analyzing student performance: a data mining approach. Journal of Computational and Theoretical Nanoscience, 16(10), 3–7. https://doi.org/10.1166/jctn.2019.8526
Wang, Y., Yang, F., Wang, D., Zhao, H., Ma, Z., Ma, P., Hu, X., Wang, S., Kang, X., & Gao, B. (2020). Correlation analysis between the pulmonary function test and the radiological parameters of the main right thoracic curve in adolescent idiopathic scoliosis. Journal of Orthopaedic Surgery and Research, 14(3), 8–12. https://doi.org/10.1186/s13018-019-1451-z